UART Plotter is a tool for graphing a line graph from a serial communication character string sent in ASCII code. It is intended for debugging in embedded development, and we emphasized that it is easy to use and that everything fits on one screen. Since we do not dare to implement advanced functions and use only the standard Windows library, the binary size is as light as about 200KB. This software is released as free software, and we are not responsible for any situation caused by using the software. If you find a problem with the product, please report it to us. Please refer to the following for the operation method of this software. Required components .Net Framework 4.0 and above(installer)
Operation confirmed environment
Windows10 pro 64bit version (Build 17134) Note)
We cannot deal with bugs other than Windows 10 because we do not have an environment.
Support without “,” at last data.
UART Plotter V1.02 2021/3/25
Release history
UART Plotter V1.01 2019/11/1
UART Plotter V1.00 released 20191/23
Operating manual
1, connection

1-1, Select the serial port you want to connect to. When you select a dropdown, it will automatically get the currently connected port and display the choices.
1-2, Click this button when connecting / disconnecting.
1-3, Indicates the port connection status
1-4, Set the communication speed of COM port.
2, Received data format
The data must be sent in ASCII format. Separate each data with a comma (,) and break the line with CRLF (rn). Possible values are from 2.22507e-308 to 1.79769e+308 (± 10-308 to 10308) of 64-bit double type supported by Windows charts. However, the longer the character string, the longer it takes to process and transfer, so the sample rate may be lower in some cases. Send data example 1,2,3, -0.1,1.0, \r\n or avobe V1.02 support 1,2,3, -0.1,1.0 \r\n
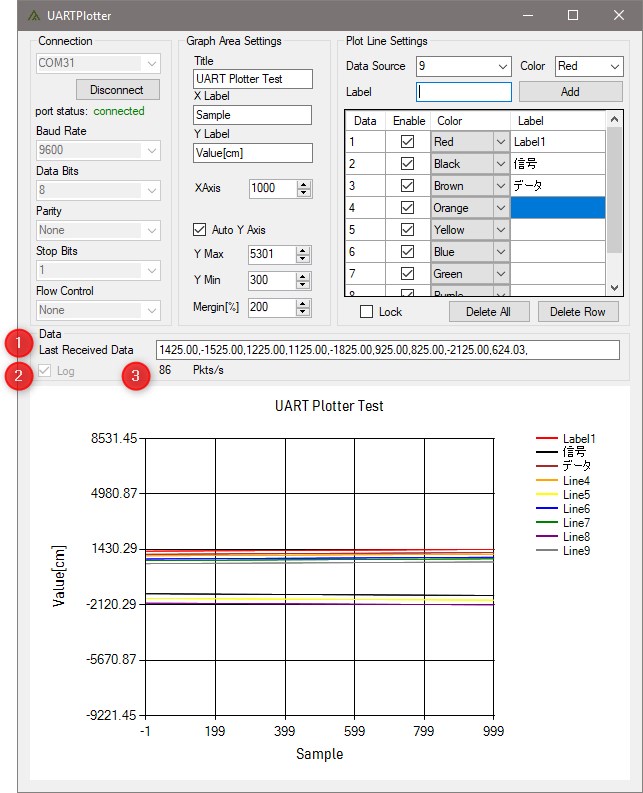
2-1, It will be the currently received data. If the process is missed in time, only the received value will be displayed.
2-2, If the Log check box is checked, a csv file will be automatically created in the same folder as the application and the received data will be saved. The name of the csv file is automatically created from the date and time.
2-3, The number of lines received per second.
3, How to display the graph
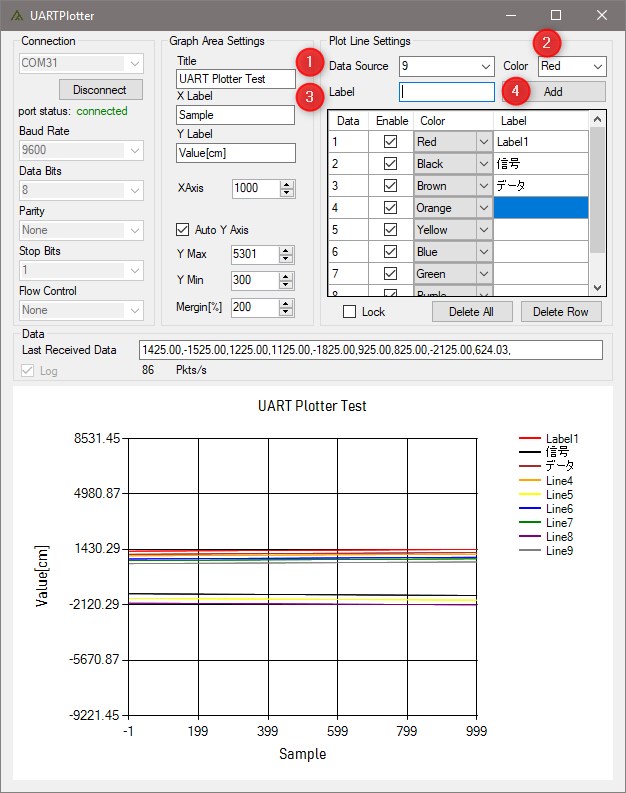
3-1, Select the data. The first data separated by commas is the first. When you open the dropdown, the source number that can be automatically selected based on the currently received data is displayed.
3-2, Select the color of the graph. The only choice is the color code of the resistor. You can also add it to the grid window and then change it.
3-3, This is the label displayed on the right side of the graph screen. You can change it later. If not specified, the Line + number will be specified automatically. You can also add it to the grid window and then change it.
3-4, Add to the grid window you have set. It will not be displayed on the graph screen until Enable is checked.
4, How to edit the graph
You can modify the graph added in items
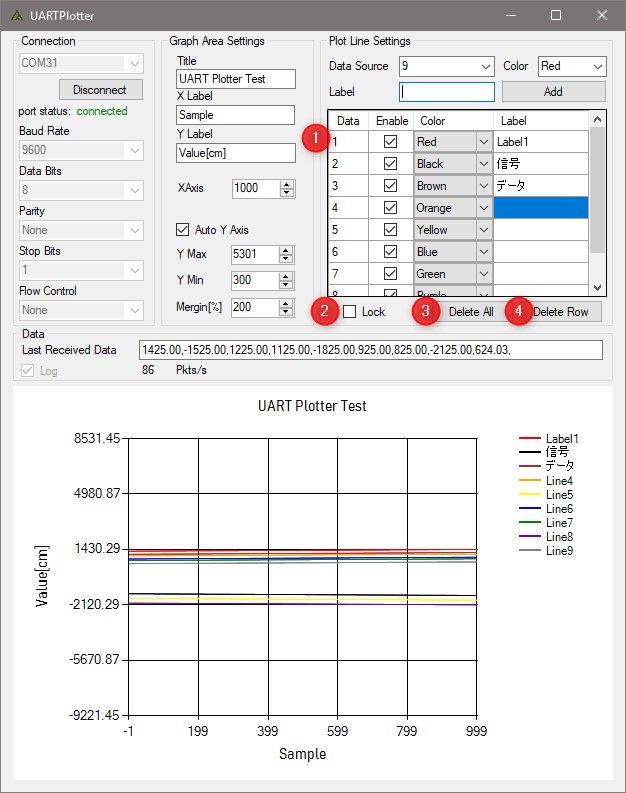
4-1, 3 in the grid window. Check Enable to display the graph. Items other than the Data number item can be changed on this screen.
4-2, This is a lock function to prevent the graph setting from being changed by mistake when the setting is confirmed. During the check, you will not be able to modify or delete 4-1.
4-3, Delete the contents of the grid window at once.
4-4, Delete the selected row in the grid window.
5, Graph screen settings

5-1, Set the title of the graph screen.
5-2, Set the X-axis label on the graph screen.
5-3, Set the Y-axis label on the graph screen.
5-4, Determine the number of X-axis. The maximum is 65535.
5-5, Y-axis is automatically adjusted from the received data.
5-6, If 5-5 is not checked, the maximum value of the Y axis is determined.
5-7, If 5-5 is not checked, the Y-axis minimum value is determined.
5-8, If 5-5 is checked, the margin width is automatically determined from the maximum value and the minimum value. If this value is 0, the maximum and minimum values of the graph will remain the maximum and minimum values of the received data. Adjust this margin if the axes of the graph continue to blur.
6, about other functions, etc.
6-1, automatic reconnection If the connection is lost except by pressing the disconnect button during the connection, it will automatically try to reconnect unless you try to change the port.
6-2, 2bytes characters support Labels that can be displayed on the graph basically support 2bytes input.
6-3, The speed of this software depends entirely on CPU performance (1 core) as it does not use GPU assistance. You can also reduce or enlarge the graph screen by adjusting the size of the window, but if you enlarge it, the performance may drop significantly.
6-4, There is no function to save the settings to a file, but the current state is saved internally when the app is closed. If you want to switch the settings depending on the target, it is recommended to copy and use the app for each target because the size of the app itself is small.